
Visualizing Big Data and the Connection to Responsive Design

 Data visualization describes techniques and tools that help people understand the meaning of data by representing it in a visual context. It’s often easier to identify important trends, correlations, and patterns in data which is presented visually rather than in its native format. Data visualization is particularly helpful in a Big Data landscape, in which many enterprises try to derive insights from huge data sets, with information obtained from myriad sources, including social media, enterprise software, and web analytics.
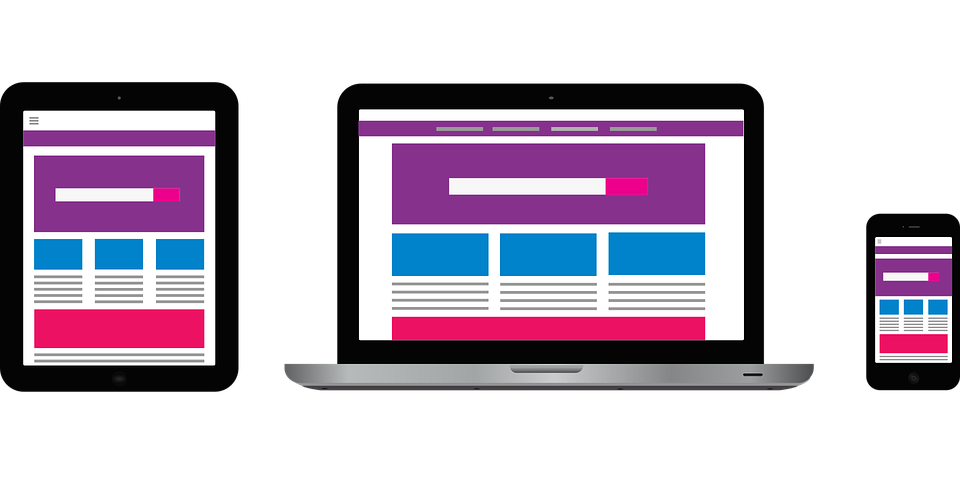
Read on to find out how data visualization is linked to another extremely relevant aspect of technology—responsive web design and responsive images..
 The process of taking data from different systems and putting it into a data warehouse for business analysis can be a complicated affair. In this article, we look at what is involved and how the cloud has made matters potentially trickier.
 In a world where organizations of all sizes
  Marketing automation means using software platforms and tools to conduct marketing strategies more efficiently and effectively by automating repetitive tasks and processes. Typical tasks marketers might automate include segmenting customers based on interactions with a website, and managing email campaigns.
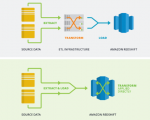 Modern enterprises gather data from many disparate sources, including social media, websites, customer databases (CRM systems, sales records etc), customer support systems, and HR software.