
Introduction
What is known today by the name Business Intelligence (BI) has an origin and evolution that should be looked at in order to introduce the concept that will be the subject of this article: “BI Usability”.
One of the principal goals of BI is that users find the information they need to make decisions in due time and proper form. The form includes, among other things, the format in which the information is presented and the level of interaction expected to obtain the desired result. The previous points make up the term “BI Usability”.
Usability can be defined as software’s ease of use, in which factors such as the familiarity of the design, comfort, attractiveness, level of interaction permitted, response time, etc. also come into play.
Various definitions of usability have been selected to complement the concept: (*1):
- The ISO/IEC 9126 defines usability as “the software's capacity to be understood, learned, used, and to be attractive to the user in specific use conditions”. At the same time, the ISO establishes four basic principles on which usability is based: ease of learning, ease of use, flexibility, and robustness.
- Jakob Nielsen, the father of usability, defines it as “a quality attribute that evaluates how easy user interfaces are to use”.
- Janice (Ginny) Redish, independent consultant, defines what an interface should allow users to do: “find what they need, understand what they find, and act appropriately, within the limits of time and effort that they consider adequate for the task”.
Business Intelligence could be defined as a concept that integrates, on one hand, storage, and on the other hand , processing, of large quantities of data, with the principal goal of transforming it into knowledge and decisions in real time, through simple analysis and exploration. This knowledge should be timely, relevant, useful, and should be adapted to the organizational context. (*2).
In the framework of these conceptual approximations to usability and BI, it is possible to propose a conceptualization of BI Usability. BI Usability refers to the design of software dedicated to BI that includes an interface that is friendly, intuitive, and easy-to-use (and easy to learn to use); an interface that allows for the creation of new contents (interactive analysis, reporting, dashboards), as well as content navigation, with an emphasis on the presentation of these contents, all in a visual and interactive manner, so the user feels comfortable with his tool and takes full advantage of his data.
Historic evolution of usability in BI
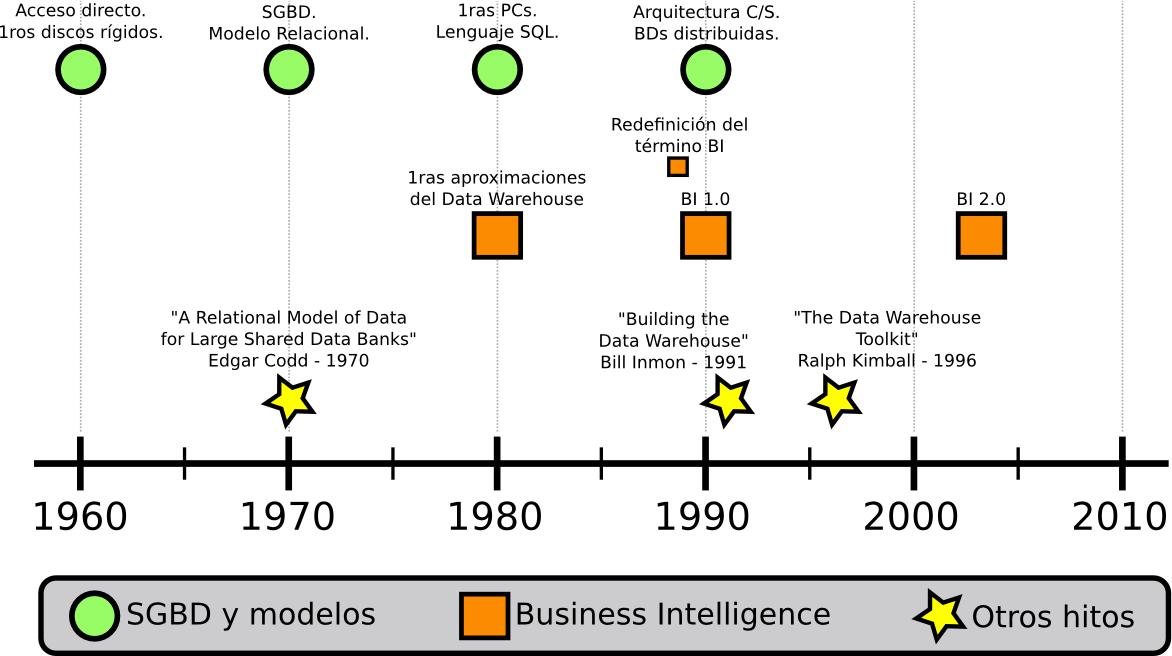
In the following we list the principal highlights that occurred and that are antecedents to the shape that BI systems have taken today regarding usability.
Figure 1 details this historical development.
In the following, the impact of usability in each of these stages will be shown.
1960s
BI information systems:
In the sixties systems were based on files with an almost total hardware dependence. They were principally oriented towards data storage and treatment, but sequential storage systems (tapes) largely impeded the possibility of managing information (*3). The emergence of direct access, together with the creation of the first hard drives, marked a milestone, after which software and hardware helped process data to obtain information.
BI Usability in this period:
In this time period, the interaction of information systems with users was very precarious. It consisted of consoles that displayed textually a series of options that the user had to select, and generally presented as many screens as options available, and after choosing these options the user obtained printed information summaries and/or specific detailed lists. Based on the definitions presented earlier, there is no doubt that in this period one cannot speak of BI per se.
1970s
BI information systems:
In the seventies the tendency was marked by the emergence of database management systems (DBMS) and the relational model that was presented in 1969 by Edgar Codd (formally published in 1970). In this decade it is possible to visualize a leap in the evolution of databases, as until then these were mainly based in network models, hierarchies, or simply structured files, whose predominant characteristic was inflexibility and physical relations between entities.
BI Usability in this period:
While databases received a great impulse from the relational model, only at the end of the decade were the first versions of systems that supported them created. At the same time, substantial improvements were produced in the responses to requirements of data and information. Interaction with the user improved notably and included interactive text interfaces. This allowed for improvements in the presentation of information per screen due to the possibility of scrolling. Despite all of this, reports continued being static and highly oriented towards transactional information.
1980s
BI information systems:
In the eighties, with the appearance on the scene of personal computers, the use of DBMS became more popular, and in 1986 the SQL language was standardized. The first approximations to the idea of a "Data Warehouse" also appeared, a concept later defined by Bill Inmon and Ralph Kimball in 1992. In 1989 Howard Dresner redefined the term Business Intelligence, which had first been used in 1958 by Hans P. Luhn.
BI Usability in this period:
Initially, the providers of the first Data Warehouses place emphasis only on the hardware and in the capacity of their DBMS, and delegated the creation of the GUI to the developers/programmers in each company. In those years, the people in charge of designing and implementing the DW ran into many inconveniences and difficulties, as these people were used to working with transactional/operational systems (OLTP), relational modelling, and, fundamentally, to facing projects of this nature. This attachment to traditional systems lead to the failure of a high percentage (some say as high as 80%) of the projects of this period, due to not understanding that the development and implementation of a DW cannot be compared to that of an OLTP, and much less is it viable to attempt to adapt methodologies and models, given that tools designed specifically for this new concept should be employed. With respect to interactivity, the improvement was notable. The programming languages allowed for creating friendlier and more user-oriented graphic and textual user interfaces. Reports were more personalizable and parameterizable, and the first information graphics (pie graph, bar graph, etc.) saw the light. Spreadsheets require a special mention, as they radically changed the interaction between the end user and information, granting the possibility of maintaining and interacting with one’s own data. But the possibilities that spreadsheets offered produced as a result piles of redundant and unorganized data, due to their not being designed to manage databases. Later, these piles were dragged along and great efforts were required to process them, organize them, and convert them into a dataset that could be used effectively.
1990s
BI information systems:
In the nineties we find organizations/businesses full of PCs, personal DBMSs, spread sheets, etc. that make up a set of heterogeneous data and decentralized and unconnected information. The architecture known as client/server (C/S) allowed for the appearance of a new paradigm in application functioning and communication. DBMSs were one of the categories that most took advantage of this architecture, giving rise to distributed databases, improving intercommunication in organizations/businesses and making databases more consistent and useful. However, there also existed a number of inherited formats (spreadsheets, plaintext files, etc.) for which the contribution of the C/S architecture was not significant, although the idea of standardizing processes of data integration was (*4).
BI Usability in this period:
The diverse publications of Bill Inmon and Ralph Kimball, where they detail how to build and design a DW, as well as defining a conceptual framework for the topic, helped to clarify concepts, and, more than anything, define a reference point, based on which DW and BI applications would be built.
At this point the first software applications oriented to DW appear, such as: IBM OLAP Server, Cognos, Business Object, SAS, Microstrategy, Oracle, etc. These tools are known as BI 1.0 applications, and their most important or notable features are the following:
- Limited with respect to analyzing large volumes of data in an acceptable time, as the physical storages structures were not optimized for this purpose. Nor were there tools to improve DW performance such as: multidimensional clusters, self-maintained aggregate tables, buffers with multidimensional structures, etc.
- Limited with respect to the possible sources of data.
- No general consensus regarding the design of GUIs for administration and navigation.
In summary, flexibility was not generally a virtue of these tools, although they fulfilled the basic tasks inherent to DW, and, more importantly, were DW-oriented.
In the first years of the 21st century, around 2003 BI 2.0 comes forth with the development of software dedicated to BI that begins to incorporate new functionalities, characteristics, and technologies, such as: interactivity, web browsers, JS, Ajax, JSON, flexibility, intuitive end-user-oriented GUIs, web services, etc. These dedicated software packages are known as BI suites.
Events
The following describes the changes and events that occurred to give shape to BI Usability.
Of the years, BI 1.0 applications saw the solution of important issues such as massive storage, response speed, modularity, etc. This was possible largely due to hardware advances such as parallelism, multi-processing, etc., and more robust software architectures and implementations such as OLEDB, JDBC, middlewares, frameworks, etc. In this context and with the passage of time, the development of BI applications gained experience and matured.
As has happened in many cases in the history of computer science, once issues that limited growth were solved, other issues that had previously been avoided or left aside were given priority. One of these issues was usability. More thought was given to the importance of BI applications being more attractive, intuitive, and easy to use so that users felt comfortable and could take better advantage of their data.
Until this point, the great majority of BI applications were desktop applications, as users were used to the response speed and user interface components (also called widgets) of this kind of application, although some offered a very limited web interface. The limitations of the web interfaces were characterized by the period in which they were developed, "before the web 2.0" in which pages were loaded completely for each requirement, the bandwidth was consumed by basic requirements, and the widgets were very basic and could not compete with the desktop versions. In short, they were not pleasant or familiar to users.
BI usability now and future tendencies
In recent years, the appearance of Ajax (*5), and with it the maturation and/or creation of technologies that allow for representing and transporting data in an efficient and standardized manner, facilitates the creation of attractive and powerful GUIs and the interaction between data and GUIs (JSON, web services, frameworks, JavaScript, flash, CSS, etc.) and has changed the web development paradigm, moving from lightweight clients to fat clients with high capacity for processing, interaction, and visualization. The applications developed with this technique are executed on the client side (fat client), which only requires of the server what is specifically needed (not the entire page, like before), which can be done asynchronously, allowing the user to never lose interactivity with the application.
The advent of Ajax and the technologies mentioned in the previous paragraph mark what is today known as BI 2.0, and tip the balance to the side of web development (*6). BI 2.0 applications focus on design and presentation of queries, reports, OLAP analysis, etc. through interactive graphics, flash and JavaScript objects, personalized and highly parameterizable dashboards, etc. All of this places emphasis on the graphic interface and user interactivity.
Currently the development and growth of BI applications and related technologies has not abated. On the contrary, it continually receives new impulses. Some of the developments that could eventually mark new tendencies for change, or even establish new milestones, are:
- Non-SQL databases.
- Cloud Computing.
- Sql Streaming.
- In-Memory OLAP.
- Mobile technologies.
- GPS-based technologies
- Touch technologies.
- Voice recognition.
- Fast prototyping.
When speaking of developing tendencies, ignoring OSBI (Open Source Business Intelligence) would definitely be an error. In recent years the growth and contribution of the free software and open source community has been large and important, with the resulting achievement that OSBI applications can compete with private applications, and, in some cases, mark tendencies and impulse very innovative ideas. As is habitual, and part of the free software and open source culture, there exist a great number of high-quality forums, blogs, wikis, and social networks (for example Open BI Network (*7)), etc. Millions of users around the world use these media as their primary form of making contributions and sharing knowledge, allowing diverse projects to grow continually and become more robust, making this software a viable and safe option.
OSBI has given small and medium-sized businesses the possibility of implementing BI solutions, which they were previously denied because of the high cost of the tools. This has greatly increased the demand for this kind of solution. This increased demand is not only with regard to quantity, but also an increase in the functional and non-functional requirements, such as: better interfaces, greater interactivity, faster responses, information delivery in diverse forms and through diverse channels, etc.
Conclusions and future work
In conclusion, we can remark that the evolution towards BI 2.0, and particularly the emphasis on usability, has developed in step with the processes of advancement and maturation of the tools and applications, the hardware utilized, user expectations of a current BI application (interactivity, familiarity, intuitive GUI, wizards, etc.) and the OSBI world.
We can assume then that this course will be maintained in similar directions as technology changes. We consider that it is not crazy to imagine a scenario in a not-so-distant future in which a supermarket stock manager approaches a shelf and orders his mobile device through a voice command while pointing the camera so that it takes in the image of various products, and immediately sees on the screen, superimposed on the image of the shelf being captured, products of the same type grouped together shown in semi-transparent colors, with the intensity of the color indicating the stock. The manager could click on one of these areas, which could show an alert icon to indicate the need for immediate restocking. The example can be enriched by imagining that in addition to these tools, the manager's mobile screen shows a graphic history of the stock where tendencies and seasonality (among other things) can be rapidly analyzed. This information would allow the manager to make a stocking decision and, through his mobile device, use a voice command "make order”, which would lead to a screen with a pre-written message for the most convenient supplier (based on distance, price, efficiency, etc.) with the order information and nothing more than the voice command "send" necessary to complete the order. The work of this imaginary supplier would be realized from and with his mobile device.
The earlier example is not a science fiction story or a fantasy. We are already on path towards this development. While still immature, the technologies exist, and are some of those mentioned earlier.
Dario Bernabeu, Grupo eGlu Mariano Garcia, Grupo eGluAuthors
Bibliography
- Wikipedia -https://www.wikipedia.org/
- "Building the Data Warehouse" - W. H. Inmon
- Articles by Ralph Kimball - "https://www.kimballgroup.com/
- "Introducción a los Sistemas de Bases de Datos” (Introduction to Database Systems) - 6/E Date
- "Diseño y Administración de Base de Datos” (Database Design and Administration) - Hansen G. W. y Hansen J. V.
- "Sistemas de Bases de Datos” (Database Systems) - 2/E Elmasri R. y Navathe S.
- "Introducción a las bases de datos” (Introduction to Databases) - Rafael Camps Paré
- "Introducción al diseño de bases de datos” (Introduction to Database Design) - Dolors Costal Costa
- "El modelo relacional y el álgebra relacional” (The Relational Model and Relational Algebra) - Dolors Costal Costa
- "Distributed systems - Principles and Paradigms” - Andrew Tanenbaum & Maarten Van Steen
Referencias
- *1 - The following definitions were taken from Wikipedia: https://es.wikipedia.org/wiki/Usabilidad
- *2 - DATAWAREHOUSING: Investigación y Sistematización de Conceptos - HEFESTO: Metodología para la Construcción de un Data Warehouse – Versión 2.0 – Ing. Bernabeu R. Dario
- *3 - Information is a set of organized, ordered, and processed data that constitutes a message that changes the knowledge state of the subject or system that receives it. Source: Wikipedia.
- *4 - Data Integration: the set of techniques and sub-processes that extracts data from different origins, manipulates it, integrates it, transforms it, dumps it into another data source, etc.
- *5 - Ajax, acronym for Asynchronous JavaScript And XML, is a web-development technique for creating interactive applications or RIA (Rich Internet Applications). Source: Wikipedia.
- *6 - The term Web 2.0 (2004–present) is commonly associated with social phenomenon, based on the interaction achieved through different web applications that facilitates sharing information, interoperability, user-centered design, and collaboration in the World Wide Web. Examples of Web 2.0 are web communities, web services, web applications, blogs, wikis, educational platforms, resource-sharing environments, and social networks. Source: Wikipedia.
- *7 - Red Open BI (Open BI Network), the first Spanish-language social network dedicated to OSBI. https://www.redopenbi.com/
Thanks: To Andrea Martino for her collaboration regarding the writing style, as otherwise this article would have been "for geeks only". To W. Zach Wolff for translation.
