Por qué el almacenamiento de objetos es ideal para los lagos de datos
Por Israel Serrano, responsable de Scality para España y Portugal


Por Israel Serrano, responsable de Scality para España y Portugal
El líder en almacenamiento de objetos cierra el primer acuerdo de siete cifras para ARTESCA mientras amplía Canal VAR y soporte de plataformas con Dell, SuperMicro y Lenovo

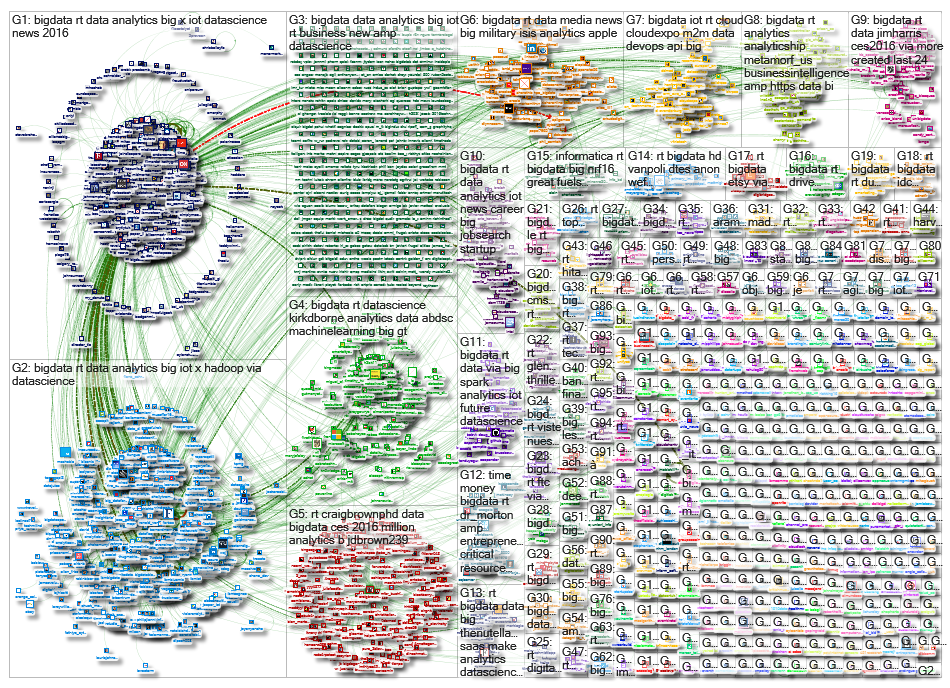 Esta semana nuestra cuenta de Twitter @dataprix ha aparecido en quinta posición del ranking de Top Influencers de BigData, elaborado a partir de un análisis de Tweets y RT realizados entre el 31 de diciembre de 2015 y el 21 de enero de 2016 que contenían el Hashtag #bigdata..
 Cap Gemini ha desarrollado un índice (CEI - Customer Experience Index) que clasifica los bancos a nivel mundial (5) y donde en el último informe del 2014 la valoración que hacen los clientes va en retroceso, así que hay mucho por hacer.
Y ... ¿Qué puede hacer Big Data? ¿En qué puede ayudar este nuevo paradigma tecnológico en mejorar esta mala percepción? Pues Big Data es una de las herramientas sobre las que se están empezando a basar los bancos para conseguir esta centralidad en el cliente. La información de los clientes está dispersa en multitud de aplicaciones, bases de datos, etc. y con este nuevo enfoque se baja toda la información al "data lake", y a partir de allí se puede tener realmente una visión completa del cliente y permitir la trazabilidad transversal de todos sus datos..
Estimad@s,
una vez más se trata de una review de un video curso publicado por Packt Publishing. En este caso les haré un comentario sobre "Building Hadoop Clusters" cuyo autor es Sean Mikha.
.jpg)
Ginni Rometty, presidenta de IBM, habló ayer por la tarde en el Mobile World Congress sobre tendencias tecnológicas y sobre algunos puntos claves para obtener ventajas competitivas en el sector. El discurso se centró en tres puntos básicos: 'Data', 'Cloud' y 'Engagement'.
![]() Las compañías y organizaciones necesitan analizar los datos, generados por sus procesos de negocio o bien datos externos de la organización. Esta necesidad obliga a crear sus data warehouses y/o data marts.
Las compañías y organizaciones necesitan analizar los datos, generados por sus procesos de negocio o bien datos externos de la organización. Esta necesidad obliga a crear sus data warehouses y/o data marts.
Vectorwise, gracias a su tecnología, es más rápido que cualquier otra base de datos analítica con un hardware equivalente. Además, en los últimos, benchmark TPCH realizados ha obtenido diferentes records mundiales. Vectorwise usa un sistema de almacenamiento por columnas en lugar del tradicional sistema de por filas, de esta forma el acceso a los datos es más ágil y rápido, recuperando sólo las columnas requeridas por la consulta.
 Esta obra está bajo una licencia de Creative Commons Reconocimiento-CompartirIgual | Presentacion | Aviso legal