
Obtén el máximo rendimiento de Tableau con ClearPeaks
Que Tableau se está convirtiendo en una herramienta de referencia en el mundo de la ![]() visualización de datos no es una afirmación que vaya a resultar novedosa. El porqué de ello y las posibilidades que ofrece quizás sean un objeto más profundo de discusión.
visualización de datos no es una afirmación que vaya a resultar novedosa. El porqué de ello y las posibilidades que ofrece quizás sean un objeto más profundo de discusión.
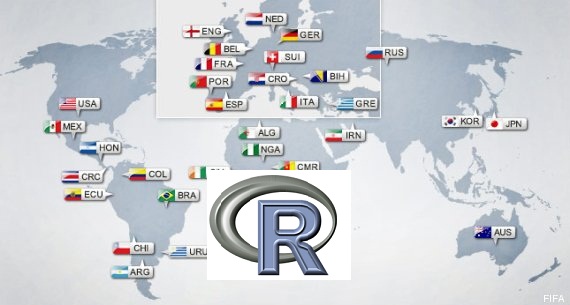 Existen numerosas librerías que permiten realizar de forma ágil mapas con R.