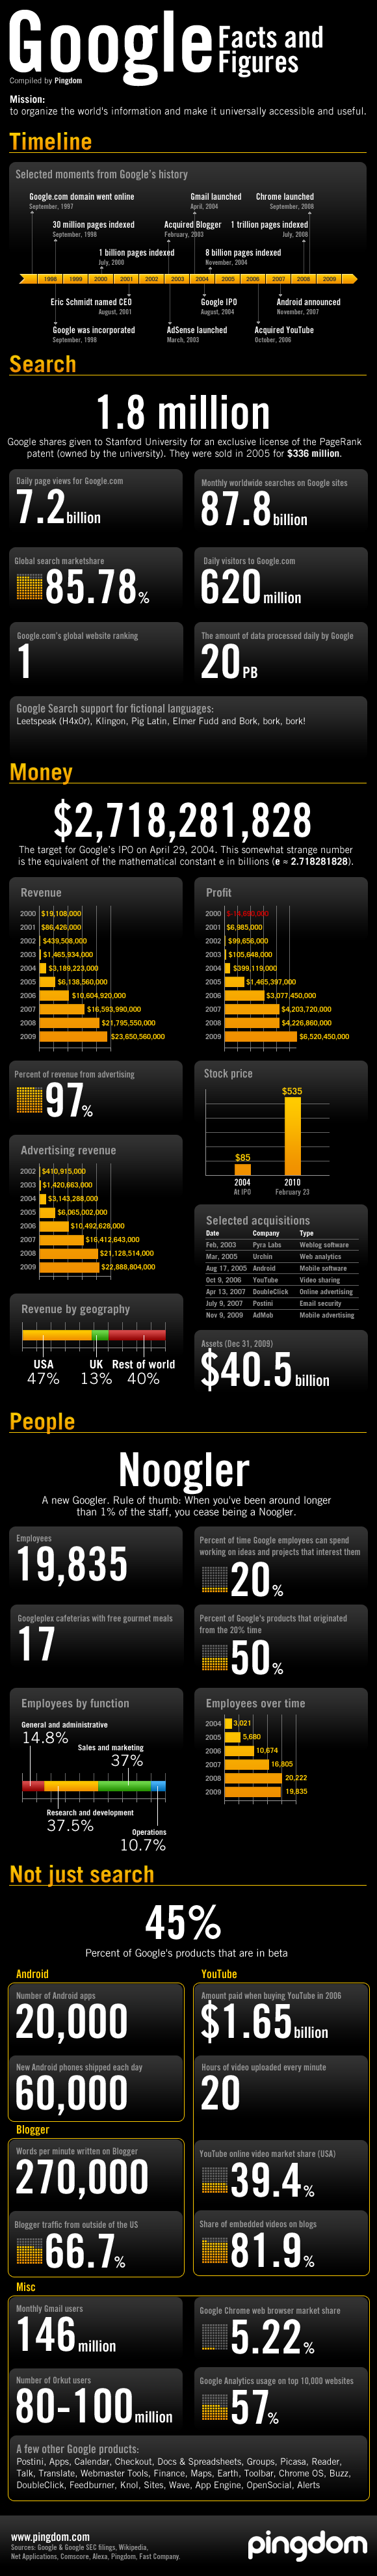

To get an idea of the volume of business that moves Google infografia nothing better than that prepared in pingdom, which collected on the same graph one timeline with key milestones of the company, impressive numbers on the form, increase in revenues , figures on company employees, and the most significant data on other successful products such as Android, YouTube, Blogger, Gmail, Chrome, Orkut or Analytics.
A good source of inspiration for anyone eager to create a scorecard where we could see these evolve dynamically as so well chosen indicators.
Surely more than one person has clicked on an indicator in the chart to see if anything more;)