
Business Intelligence and Analytics TOP 10 Software


This post, which summarizes the TOP 10 Business Intelligence and Analytics software from Dataprix's directory, will help you quickly compare each option and choose the right one for your organization..
 />
/>
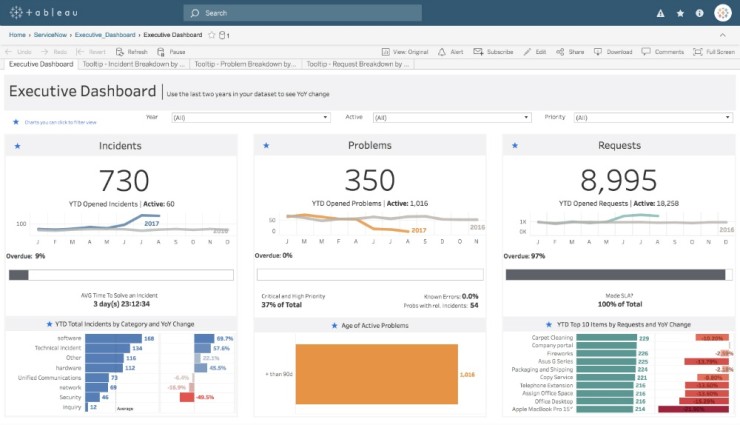 Tableau is a business intelligence platform focused on transforming complex data into interactive visualizations and intuitive dashboards.