
R is an open source suite of utilities and a programming language for data manipulation, statistical calculations, analytics and graphics visualisation.
The environment is easily extendable with new packages (statistics, graphics, analytics, etc.) contributed by the community of R users and developers.
Given its flexibility, its capabilities and the fact that it is free software, a large number of business applications, especially business intelligence and analytical software, are creating connectors with R, or even integrating it within the tool itself.
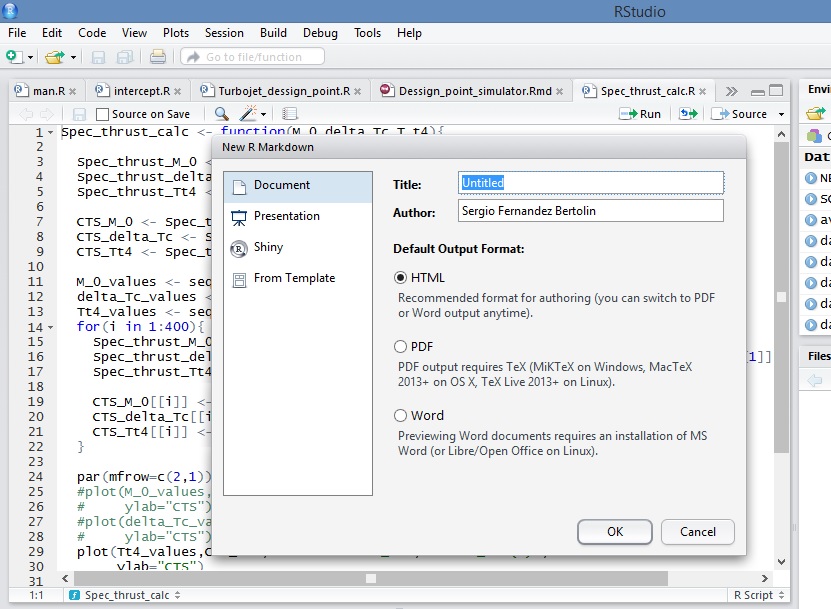
There are several IDE's or visual environments that facilitate working with R, but perhaps the most widespread is RStudio, whose Desktop version is also distributed as Open Source.
Recursos about R
Learning
Resources
Download page for R distributions and packages
Spanish manuals about R
- “R for Beginners”, the Spanish version of “R for Beginners”, translated by Jorge A. Ahumada (PDF).
- A Spanish translation of “An Introduction to R” by Andrés González and Silvia González (PDF,Texinfo sources).
- “Statistical Graphics with R” by Juan Carlos Correa and Nelfi González (PDF).
- “Letters on Statistics from the Revista Argentina de Bioingeniería” by Marcelo R. Risk (PDF).
- “Introduction to the use and programming of the R statistical system” by Ramón Díaz-Uriarte, transparencies prepared for a 16-hours course on R, addressed mainly to biologists and bioinformaticians (PDF).
- “Automatic report generation with R and LaTeX” by Mario Alfonso Morales Rivera (PDF).
- “Statistical Methods with R and R Commander” by Antonio Jose Saez Castillo (PDF, ZIP, 2010-07-08).
- “Mathematical Optimization with R: Volume I” by Enrique Gabriel Baquela and Andrés Redchuk (PDF, 161 pages).
Data sets and complementary information are available athttps://www.modelizandosistemas.com.ar/p/optimizacion-con-r.html. - “An introduction to the use of R and R Commander for statistical analysis of social science data.” by Rosario Collatón Chicana (PDF, 128 pages, 2014-05-11).
- “The art of programming in R” by Julio Sergio Santana and Efraín Mateos Farfán (PDF, 197 pages, 2014-12-15; online).
R publications in Dataprix
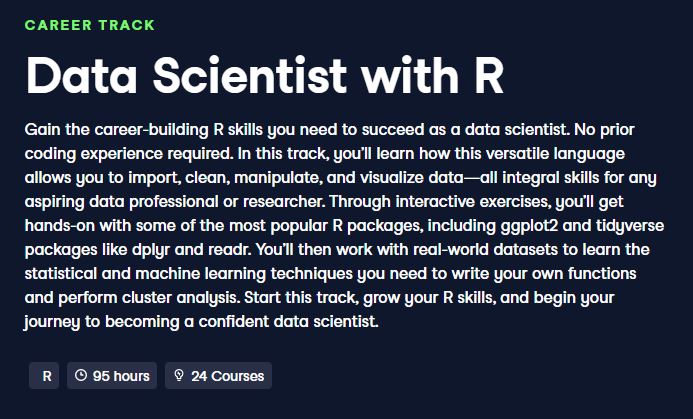
Free R and Data Science Books and Resources
Resources to learn how to work with R and do Datamining or Data Science activities.
Exploratory analysis in R
Data Science - A Brief Guide to Interpreting Cluster Models
In clustering, data are allowed to be grouped according to their similarity. These models are groupings of segments - clusters - that contain cases, such as customers, patients, cars, etc.
Once a cluster model is developed, a question emerges: How can I describe my model?
Here we will present a way to get closer to the answer, through the implementation of the Coordinate Graph in R (code available at the end of the post).
Data Science - Dynamic analysis of outliers with R
Outliers, or "outliers", are an ever-present issue when analysing data, regardless of its origin.
Here we present a didactic and visual analysis done with the R language...
Geo Data Science with R
The following analysis is carried out with the R language and the Google Vis library for the visualisation of graphs. It is as important to measure life expectancy as it is to measure the quality of life. We will analyse eurostat data based on the variables Healthy life years and Life expectancy....
Learning how to create automatic reports from R with rmarkdown and knitr
Last week I attended a meeting of RugBcn, the Barcelona R User Group, which aimed to show how to create automatic reports directly from R thanks to the rmarkdown and knitr libraries. The title of the event was 'Automatic Reporting with rmarkdown'...
- Log in to post comments
