
SAS Visual Analytics es una solución de analítica de negocio que permite explorar visualmente todos los datos con un interfaz fácil de usar y accesible a usuarios de todos los niveles, sin necesidad de conocimientos estadísticos, técnicos o de diseño.
Visual Analytics dentro de las soluciones B.I. disponibles en el mercado se posiciona dentro de las soluciones de visualización analítica. En este grupo tenemos soluciones como Qlikview, Tableau, Tibco Spotfire y otros. De forma resumida la propuesta de este tipo de soluciones es la siguiente:
- Las herramientas de visualización analítica permiten realizar análisis interactivo apoyándose en ágiles funcionalidades de visualización y gestión de datos, permitiendo realizar un análisis libre sobre el modelo de datos importado en la herramienta.
- La orientación de estas herramientas suele ser de autoservicio B.I., facilitando la integración y análisis de datos con poca intervención de IT
- Las capacidades de visualización, permiten así mismo realizar presentaciones claras y eficaces que ayuden en la toma de decisiones.
- Agilidad y rapidez en el manejo de datos apoyándose en tecnologías in-memory.
- Estas herramientas se apoyan en una interfaz intuitiva que facilita la exploración de datos orientada tanto a perfiles TI como analistas de negocio
SAS Visual Analytics ofrece una plataforma completa para la visualización analítica, lo que permite identificar los patrones y las relaciones de los datos que antes no eran evidentes. Las capacidades interactivas de BI y reporting de autoservicio se combinan con la analítica avanzada para que todos puedan descubrir conocimientos de cualquier tamaño y tipo de datos.
Vamos a conocer las características de la herramienta, analizando cada uno de sus módulo principales, así como su arquitectura técnica:
- Preparación de datos: importación y preparación de datos para su posterior visualización y análisis.
- Análisis exploratorio: módulo para explorar, analizar y visualizar los datos, con objeto de identificar patrones, tendencias y conocimiento en los dato.
- Diseñador de informes: módulo de reporting para diseño de informes y dahboards.
Preparación de datos
SAS/VA dispone de un módulo de importación de datos y otro de preparación de datos basado en SQL que permite adecuar los datos importados a la estructura óptima para su explotación.
Para obtener la mayor potencialidad de análisis es recomendable que la herramienta trabaje sobre una tabla agregada que consolide la información de varias tablas y fichero de partida. Se trata de el clásico tablón obtenido como cruce de N tablas de hechos y dimensiones. La herramienta también habilita la opción de trabajar con un modelo en estrella en el que la tala de hechos y las dimensiones serían tablas independientes.
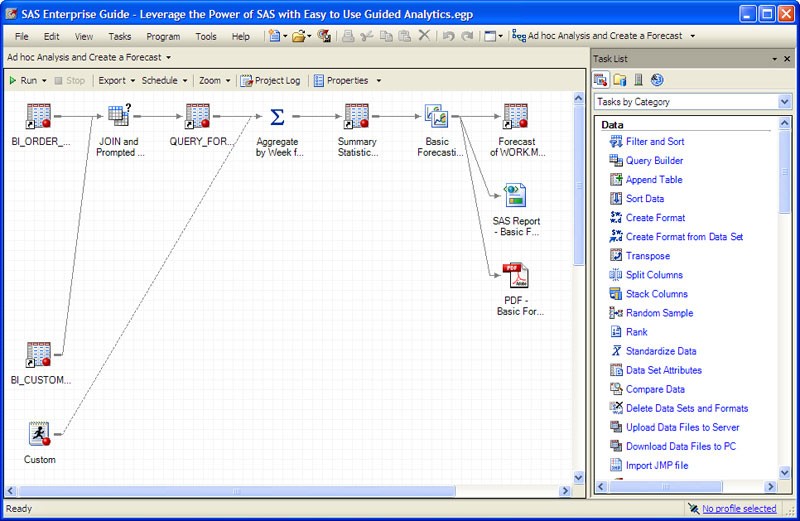
La herramienta dispone de un módulo para preparación de datos que permite realizar transformaciones sobre los datos importados basadas en SQL realizados en un query builder. Es posible que este módulo se quede un tanto escaso cuando las transformaciones a realizar son medianamente complejas, en este caso SAS propone el uso de Enterprise Guide, ofreciendo la opción Visual Analytic Pro (Visual Analytics + Enterprise Guide).
Sobre los campos de las tablas importadas es relativamente sencillo derivar campos utilizando los elementos calculados que de una forma sencilla da acceso a un potente editor de expresiones.
Análisis exploratorio
Una de las principales diferencias de SAS con respecto a otras herramientas de visualización analítica son su capacidades de análisis avanzado (técnicas predictivas, series temporales, asociaciones, etc..) basándose en la larga experiencia de SAS en herramientas de este tipo como SAS/Enterprise Miner. Los algoritmos a aplicar en análisis predictivo se detectan automáticamente, pudiendo obtener info de detalle del algoritmo seleccionado. Es posible crear de forma sencilla árboles de decisión para realizar grupos o clasificaciones en los datos, así como diagramas de box-plot para conocer en profundidad la distribución de los datos.
Posibilidad de obtener de forma sencilla series temporales para realizar proceso de forecasts. Estos procesos son muy sencillos de implementar, pero se quedarían cortos si pensamos en un forecast más industrializado que permitiera realizar un forecast masivo cuyo resultado sería entrada para otros sistemas (ejemplo previsión de necesidad de stocks), en estos casos es más recomendable ir a soluciones tipo SAS Forecast Server.
En los procesos predictivos, podemos emplear la funcionalidad "factores subyacentes" que nos permite evaluar cómo afectan otras variables a nuestra predicción pudiendo realizar análisis de escenarios y simulaciones “what-if”.
Posibilidad de conectarse mediante add-in a Visual Statistics para procesos de análisis estadístico más avanzados.
Utilidades para conocer las relaciones entre las variables, tales como matrices de correlación. Estadísticas descriptivas que permiten conocer la distribución de valores en las variables (mínimas, máximas, media, nulos, etc..)

Diseñador de informes
Diseñador de informes de uso muy intuitivo (arrastar y soltar). De forma sencilla podemos crear informes o dashboard utilizando los objetos de gráficos y visualización en lo que incluimos los indicadores o clasificadores que seleccionemos.
Posibilidad de incorporar a los dashboards documentos de análisis obtenidos en los procesos de análisis exploratorio.
Una vez diseñados un serie de objetos gráficos sobre un documento podemos definir interacciones entre ellas, para relacionar las selecciones realizadas en algunos de ellos con otros objetos o para definir una navegación entre los mismos.
SAS Visual Analytics incorpora múltiples posibles visualizaciones diagramas de cajas, mapas de calor, gráficas de burbuja animadas, diagramas de red, árboles de decisiones, geolocalización. Así mismo, las capacidades de autocharting que ayuda a determinar la gráfica más adecuada para desplegar los datos según los elementos seleccionados para el análisis. Una barra de visión general permite hacer zoom sobre los rangos de datos que se deseen sin perder la visión completa.
Organización en dimensiones y jerarquías para realizar análisis OLAP multidimensional.
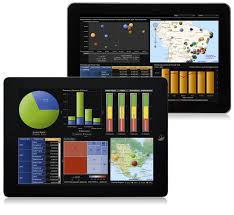
Creación, visualización, publicación y distribución de análisis e informes multidispositivo. Integración con Office: Outlook, SharePoint, Excel y Power Point
Arquitectura técnica
Los tiempos de respuesta son ágiles debido a que los datos son cargados en memoria, basándose en SAS LASR (servidor analítico en memoria de alto desempeño).
Solución orientada a Cloud con opción también on premise
En resumen, se trata de una potente herramienta de visualización analítica, que es una interesante opción para aquellas empresas que sin tener que realizar una gran inversión inicial, quieran empezar a realizar analítica, con la posibilidad de escalar y crecer hacia otras herramientas.
- Log in to post comments
